Follow-COVID:
A journey from paper to the Innovation Gateway
By Gabriella Linning
Scott Horban, CO-CONNECT Data Team Leader, tells me what it took to get the Follow-COVID cohort live on the HDR Innovation Gateway.
Table of contents
Follow-COVID is one of the projects my CO-CONNECT colleagues have partnered with to make their cohort data available on the Health Data Research (HDR) Innovation Gateway’s Cohort Discovery Search Tool.
Out of all the cohorts the team has successfully worked on thus far, Follow-COVID has, perhaps, the most interesting route to being discoverable.
Led by Dr David Connell at the University of Dundee, Follow-COVID looks to identify the long-term impacts and future healthcare needs of patients who have become severely ill with COVID-19.

Gathering the data
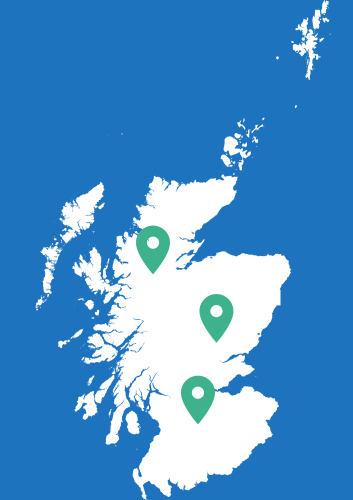
At the beginning of Follow-COVID, patient volunteers attended clinics in the Tayside, Lanarkshire & Highland regions of Scotland, where they answered extensive paper-based questionnaires.
Instead of being a basic form-filling exercise, however, clinical staff actively engaged with their volunteers in an interview-style set up. A staff member would read the questions out to a volunteer, the volunteer would provide their answer, and the staff member would fill in their answer on the questionnaire form.
Afterwards, it was the job of CO-CONNECT team members Scott Horban and Shameema Farvin Stalin to design a digital structure that would allow for the information given in the questionnaires to be “input into an efficient electronic format”.
Essentially, this means they had to design a digital template that the questionnaire information could be typed into. This template would re-organise and store the information in a way that is more efficient for a computer to process, and therefore, for researchers to use.
But why was this process necessary? Why could the patients’ answers not simply be copied from the questionnaire and typed into a computer? If the information needed to be stored electronically, why was the questionnaire not designed to be compatible with the structure of a computer database?
Scott tells me it was simply due to how quickly the project was developed in response to the global pandemic.
“…the pressures and timescales of COVID-19 expedited the entire process…..meaning [we] were not involved until after the forms had been designed and data had been collected.”
In other words, the speed at which Follow-COVID was established, and its data collection processes were designed, meant there was no opportunity for Scott and his colleagues to provide their expertise in designing the questionnaire.
Now, I must stress that this method of data collection in no way negatively reflects the quality of the information collected, or the skill of the researchers involved in it. Researchers in different fields have differing expertise and skills.
Scott’s medical research colleagues were able to create an effective form to gather comprehensive information about their volunteers, it simply lacked the structure to be conveniently and constructively stored electronically. Therefore, Scott and his team “had to design a structure which reflected the content of the Case Report Forms but also worked in an electronic database setting”.
Data entry by the box load
Once their work was done, Scott’s team turned over their work to their colleagues on the Data Entry Team at the University of Dundee’s Health Informatics Centre (HIC).
Scott says that what happened next was quite a sight, with Follow-COVID’s forms “literally [coming] to HIC in cardboard boxes”.
Apparently, the Data Entry Team then spent two months manually entering and checking around 40 double-sided pages of data for each participating volunteer.
“The 83 patients from Tayside and Lanarkshire alone required the HIC team to input 47,842 individual data values.”
Whilst this situation may seem odd in the world of health data research, Scott assures me that this type of task is actually not that uncommon “[data entry] has been one of HIC’s core areas of service for many years, so while we expected the manual entry process to take some time, our data entry experts were well prepared for and experienced in this type of work.”
Either way, it is certainly more laborious and low-tech than I imagined.


The CaRROT, the rabbit and the Gateway
After the Dundee data entry team completed this time consuming and meticulous task, however, is when all the seemingly complex science-y and tech-y stuff began to happen.
Scott did an excellent job explaining the process of how a cohort is integrated into the Gateway’s Cohort Discovery Search Tool. Now I will do my absolute best to pass on the message. To help me do this, I have also created a “Jargon Buster” down below to help explain some of the more technical terms.
The first, and perhaps most important step, was for Follow-COVID’s data to be de-identified. This makes sure that the individuals included in the cohort cannot be identified by researchers who handle or use the data.
After the data has been de-identified, it is then time for it to be “pre-processed”. Pre-processing happens for two reasons: (1) to help maintain data security and governance (I’ll expand upon the reason why later) and (2) to help make sure that the data is understandable to something called the CaRROT-Mapper Tool (which I will also refer back to shortly).
Pre-processing involved using a tool called OHDSI WhiteRabbit to generate metadata representing the de-identified data.
This stage is done by the Data Partner in charge of the cohort with support provided by the CO-CONNECT team. In the case of Follow-COVID, HIC were acting as the Data Partner, so the generation of metadata was supported by Erum Masood, who also works at the University of Dundee (Follow-COVID’s Data Custodian).

The Jargon Buster
A cohort is any group of people with a shared characteristic.
In this case, the Follow-COVID cohort is all of the people who volunteered to participate in the Follow-COVID study.
The Follow-COVID data or dataset is all of the information provided by the people involved in the study (the Follow-COVID cohort) which researchers use for their research.
The Health Data Research Innovation Gateway is a portal enabling researchers and innovators in academia, industry and the NHS to search for and request access to UK health research data.
The Gateway was developed with input from patients and researchers, and provides a library of information including data held and managed in the NHS, research charities, research institutes and universities. Researchers can search, browse and enquire about access.
The Innovation Gateway does not hold or store any patient or health data.
CaRROT-Mapper is a piece of software that was developed by the wider CO-CONNECT development team, based at the Universities of Nottingham, Edinburgh and Dundee.
Metadata is data that describes or gives information about other data.
In this case the metadata is describing or giving researchers information about what is happening in the Follow-COVID cohort.
This may include the headlines, table column names, types of data and totals.
How is the cohort’s data organised? How many headings or categories are used?
What are these categories called?
What types of data do these categories organise? Yes and no questions? description boxes? multiple choice answers?
How many women are in the cohort?
How many people in the cohort have asthma?
To learn more about, and see further examples of metadata, please visit: What is Metadata (with examples) – Data terminology (dataedo.com)
CO-CONNECT are collaborating with a range of organisations who host and manage data. They are the legal data controllers of the data. We term them CO-CONNECT “Data Partners”.
A Data Source (or cohort as written in this article) is a specific data set hosted and managed by the Data Partner.
Mapping can be defined as transforming the data to fit a widely agreed upon standard structure so that it can be more easily compared with other datasets.
Essentially, with mapping you are aiming find a common format that can be used to link the data of multiple datasets together.
It can be viewed a bit like phone chargers – a few years ago every manufacturer had their own different connector, but now everyone has uses the likes of USB-C, meaning standard cables can be used across many more phones without an adapter.
Each cohort, database or dataset will have their own method or structure which they use to record and organise their data. This can make it difficult for researchers to look for or use information across multiple cohorts, as the same type of information might be recorded in different ways (such as different coding languages) or stored in different locations.
Using a Common Data Model (CDM) is one of the ways data researchers use to overcome this problem. CDMs are software tools that can help pool together data from various data-sources (such as the cohorts of CO-CONNECT’s data partners).
In a sense, CDMs are third-party data translators, reading the different coding languages used in each cohort and re-writing their information in one standardised, easy to read language that is easier for researchers to search through.
Another method of visualising how CDMs work involves a bit of imagination.
Picture that you are on a website that sells cans of paint from various brands.
Now, for the sake of argument, also imagine that each brand organises their paint differently on their own websites. For example, some may first organise their paint by block colour, then shade. Others may organise by finish (e.g. matte, glossy) then colour, then shade.
When deciding what shade a can of paint is, one brand may simply label their paints as being ‘light’ or ‘dark’, another may label their’s as being ‘very light’, ‘light’, ‘neutral’, ‘dark’ or ‘very dark’ and so on.
Furthermore, each brand will have different ways (or languages) for how they name their paints. One brand may be very direct, saying they sell light blue, very light blue and very dark blue. Another says they sell duck egg blue, sky blue and sea blue. Some may just say they sell paint colours called duck egg, sky and sea. Other brands may sell “azul” paints.
This is all to say that searching for information on the different blue paints across these imaginary websites would be incredibly inconvenient.
Finding out how many different cans of blue paint are available in shops near me? Or how many light blues are there with a matte finish? These types of questions would take you a long time.
Therefore, instead of manually sifting through all of these different websites, you go to one retailer that sells paint cans from multiple brands (our CDM). It re-organises all of the paint cans from across these different websites into one, single, standardise categorical system. One that is easy to navigate and search through with the help of filters.
The metadata was then standardised, meaning it was converted into a format that was easier for the CaRROT-Mapper tool to read.
The metadata is mapped by the CaRROT-Mapper in order to create a list of rules or instructions that can be used later on to help map the real, de-identified data.
Mapping the metadata allows CO-CONNECT to help Data Partners prepare their cohorts for on-boarding onto the Cohort Discovery Search Tool, without compromising data security. This is because the CO-CONNECT team never handle the real data themselves.
Instead, the CO-CONNECT team then use the metadata to create synthetic or ‘pretend’ data. This synthetic data is then used alongside the list of instructions created earlier to test how good the metadata mappings are. This is done by running them through another software tool called the CaRROT-CDM (Common Data Model), which was developed by the Universities of Nottingham and Edinburgh.
Provided the test goes well, the CO-CONNECT team then tell the Data Partner how to use the information gained from the test to run the CaRROT-CDM on the real, de-identified data.
The Data Partner can then test the CDM and ensure data security within their own controlled and secure testing environment.
The CaRROT-CDM works by re-organising the Follow-COVID data into a standardised format, which allows it to be directly compared with other cohorts on the Cohort Discovery Search Tool.
This is what allows Cohort Discovery to search across all featured data cohorts to answer researchers’ initial explorative questions when searching for relevant datasets.
Where can I find out more about...
If you are interested in finding out more about how CO-CONNECT prepares data to be onboarded onto the Cohort Discovery Search Tool, watch our demonstration videos on YouTube at: CO-CONNECT Data Pipeline demo videos – YouTube
The three benefits of collecting data on paper
So, there you have it. This is all the work that was needed to get this one, singular cohort live and accessible through the HDR Innovation Gateway.
But perhaps, you are like me as I was during my conversation with Scott, left wondering: Why was the patient data collected on paper in the first place? Why did the researchers not just use the same form, but on a computer to save some time?
Scott’s answer?
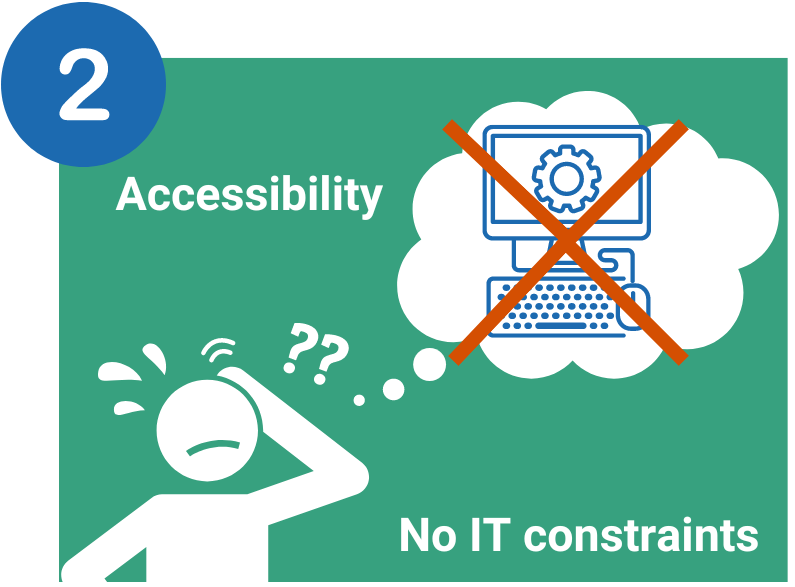
“accessibility, flexibility and timeliness”.
Paper-based data collection also removes any IT literacy constraints from study design, as it means that any clinical member of staff could record the information without the need for any special access or training to use a computer system.
Scott says that the rigid structure of an electronic recording system can make it challenging to effectively categorise information that a patient provides, especially in an interview setting. In contrast, Scott says “with a pen and paper a clinician can write down any notes that they require”.
Finally, we have timeliness, which we coincidently touched on earlier. In this situation collecting data on paper was far more convenient. As Scott pointed out “the pandemic struck so suddenly and gathering data during its early stages was of utmost importance”. Therefore, it was more important to gather data rather than designing a method of holding it.
Final thoughts
So, contrary to popular belief, scientific research is not always as high-tech and automated as we might think. The story of Follow-COVID truly highlights the value that seemingly old-fashioned methods still have in the new age of health and data science. What’s most important is the quality of the data gathered, as well as the anonymity, comfort and security of the patients invovled.
This article was reviewed in consultation with members of the CO-CONNECT Patient Understanding Group (PUG).


